Private credit is no longer a niche workaround created by post-2008 bank retrenchment. By the Alternative Credit Council’s count, global private-credit AUM reached $3.5 trillion by the end of 2024.
But that headline number masks the real analytical problem: private credit is not a single market.
Corporate lending still accounts for about 60% of the asset class, but asset-backed lending, real estate debt, infrastructure debt, and special situations now account for the rest. So the real question is not whether “private credit” is a bubble in the singular. The question is whether investors have treated a set of very different credit strategies as a single, homogeneous, low-volatility asset class 1.
Regional Differences in Private Credit
Regionally, the differences are stark. The U.S. remains the core market, accounting for about 65% of global private-credit AUM and still dominating sponsor-backed direct lending. Europe plus the UK accounts for roughly 28% of global AUM, and many managers still see it as the strongest relative-value growth market because bank disintermediation and market fragmentation are less advanced than in the U.S. Asia-Pacific is smaller but structurally distinct: AIMA projects APAC private credit to grow from $59 billion in 2024 to $92 billion by 2027; the region spans more than 50 jurisdictions, about 90% of deals are sponsorless, direct lending accounts for about 27% of AUM, and special situations about 36%. That is not a mini-America. It is a different market architecture altogether 2.
Strategy Matters: Different Risk Engines
The strategy mix matters just as much as geography. Direct lending is still the workhorse, underwritten mainly on cash flow, leverage and sponsor quality. Asset-based finance is different: it is underwritten primarily on collateral, legal control and asset performance. Infrastructure debt relies more on contracted cash flows, asset life, and policy durability. Special situations and capital solutions sit further out on the risk spectrum and demand more restructuring skill, legal work and tolerance for idiosyncratic outcomes. The market is also moving upmarket. In October 2025, Meta and funds managed by Blue Owl formed a joint venture to develop the Hyperion data-centre campus in Louisiana, with approximately $27 billion in development costs. Blue Owl stated that part of its capital would be funded by debt issued privately to PIMCO and select bond investors. That is an important marker: private credit is no longer just middle-market buyout finance; it is increasingly part of the financing stack for AI and digital infrastructure 3.
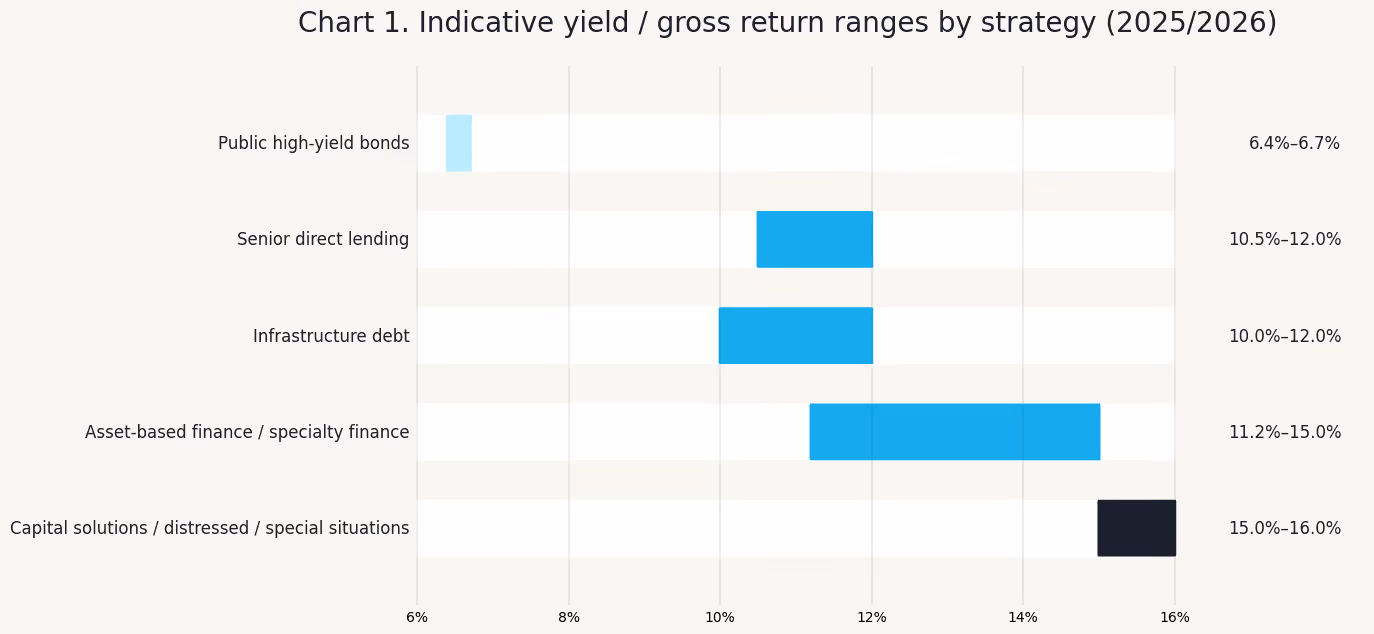
In Chart 1, public high yield refers to the current market yield, while private-credit figures are generally quoted as target returns or recent gross returns. The public-HY comparator here is the ICE BofA U.S. High Yield Index effective yield, which ranged from 6.43% to 6.69% in late January and February 2026. The private-credit ranges combine representative manager disclosures: KKR’s June 2024 market review showed target returns of 10.5%–11.0% for U.S./EU direct lending, 15.0% for ABF, and 15.0%–16.0% for junior debt/capital solutions/distressed; HSBC AM said its infrastructure debt strategy was delivering at the top end of a 10%–12% gross IRR target range; Apollo reported recent gross returns of roughly 11.2%–11.9% in asset-backed finance and 12.0% in direct origination. These are directionally comparable, not apples-to-apples pricing screens 4.
The point is not that private credit offers a clean, stable premium over public high yield. The point is that “private credit” contains very different risk engines. Senior direct lending and infrastructure debt still sit closer to income-oriented credit. Asset-based finance, capital solutions and special situations pay more because they involve greater complexity, less standardisation, harder workouts and, usually, less liquidity5.
Default Rates Depend on How You Measure Them
That same analytical sloppiness shows up in the default debate. The most flattering private-credit numbers are manager-reported non-accruals or payment defaults. AIMA’s 2025 survey showed that flagship corporate-lending funds had an average non-accrual rate of 2.2% and a weighted-AUM rate of 1.8%. Proskauer’s U.S. Private Credit Default Index printed 2.46% for Q4 2025. Measured that way, private credit still looks better than the main public benchmark: S&P put trailing speculative-grade corporate default rates at 4.6% in the U.S. and 3.8% in Europe as of end-April 2025, with a base-case projection of 4.0% and 3.6% by March 2026. That is already one important caveat: the cleanest published public comparison is usually speculative-grade corporates, not a pure high-yield-bond-only default rate.
But those low private-credit figures are not the whole story. AIMA itself points to Houlihan Lokey’s 7.4% “proxy default” rate as of September 2025, a measure that includes payment defaults, covenant defaults and amended PIK interest. Fitch’s monitored U.S. private-credit cohort rose again to 9.2% in 2025, and Fitch explicitly included distressed debt exchanges. Europe adds another layer of opacity: Goldman Sachs Asset Management found 150 European credit events since 2017 across roughly $38 billion of LBO financings, but only four were bankruptcies or liquidations; the rest were largely debt-for-equity swaps.
So the real issue is not whether private credit has “no defaults.” It is that stress is often internalised, restructured or relabeled rather than immediately surfacing as a public bankruptcy.

The balanced conclusion is tougher than either side likes. Private credit may genuinely benefit from tighter documentation, closer lender control and more flexible workouts than syndicated markets. But low visible default rates do not automatically mean low loss severity. A Federal Reserve note found post-default value at about 33% for direct loans, versus 52% for syndicated loans and 39% for high-yield bonds, in part because private credit is heavily exposed to sectors with lower tangible collateral. So, private credit is not obviously safer than public high yield. It is better thought of as a market where distress is often handled earlier, privately and with more lender control, but not necessarily with better recoveries once things actually break 5.
The Real Risk: Liquidity Mismatch
The more convincing “bubble” signal is not the default statistics. It is liquidity packaging. Semi-liquid vehicles promise periodic redemptions from loans designed to be held. In March 2026, Morgan Stanley’s North Haven Private Income Fund met only 45.8% of tender requests. BlackRock’s HPS Corporate Lending Fund disclosed that shareholders asked to redeem about 9.3% of shares, and the fund stuck to its 5% repurchase framework. Those are not signs of a 2008-style systemic collapse. They are signs that the asset-liability mismatch becomes very real as soon as confidence weakens.
So are we in a private-credit bubble? Not in the clean 2008 sense. The industry still relies heavily on closed-end capital, and AIMA says fund-level borrowing remained modest at about 32% of net AUM, with 80% of private-credit assets held in closed-ended structures. But the market is clearly leaving its easy phase. The next cycle will be about manager dispersion, honest classification of defaults, real scrutiny of valuations and a much sharper distinction between direct lending, asset-based finance, infrastructure debt and opportunistic credit.
Private credit is not going away. But the era when it could be marketed as one uniformly resilient asset class should be over. For a strategy-by-strategy breakdown of where senior-secured private credit sits in this stress test — and how Kilde measures defaults and liquidity differently — see what the 2026 data actually says.
Sources:
- Alternative Investment Management Association (AIMA). Financing the Economy 2025. London: AIMA, 2025. https://www.aima.org/static/e18bf558-90f4-4551-9d3fc002b498afc4/b0234dc6-4f8e-4f82-96fdd5dccae2a382/Financing-the-Economy-2025.pdf.
- Alternative Investment Management Association (AIMA). "Private Credit Market Surpasses US$3 Trn and Maintains Resilience Despite Growing Stress." AIMA. Accessed March 15, 2026. https://www.aima.org/article/press-release-private-credit-market-surpasses-us-3trn-and-maintains-resilience-despite-growing-stress.html.
- Alternative Investment Management Association (AIMA). "Strong Growth Sees Private Credit Market Reach US$3.5 Trillion." AIMA. Accessed March 15, 2026. https://www.aima.org/article/press-release-strong-growth-sees-private-credit-market-reach-us-3-5-trillion.html.
- Federal Reserve. "Private Credit: Characteristics and Risks." FEDS Notes, February 23, 2024. https://www.federalreserve.gov/econres/notes/feds-notes/private-credit-characteristics-and-risks-20240223.html.
- Federal Reserve Bank of St. Louis (FRED). "ICE BofA US High Yield Index Effective Yield (BAMLH0A0HYM2EY)." Last updated February 2026. https://fred.stlouisfed.org/data/BAMLH0A0HYM2EY.txt.
- KKR. Run, Credit, Run: June 2024 Market Review. New York: KKR, 2024. https://www.kkr.com/content/dam/kkr/insights/pdf/run-credit-run.pdf.
- Reuters. "Morgan Stanley Restricts Redemptions in Private Credit Fund after Withdrawals Surge." Reuters, March 11, 2026. https://www.reuters.com/business/finance/morgan-stanley-restricts-redemptions-private-credit-fund-after-withdrawals-surge-2026-03-11/.
Disclaimer Notice
This page is provided for general informational purposes only and does not constitute legal, financial, or investment advice. Please refer to our Full Disclaimer for important details regarding eligibility, risks, and the limited scope of our services.


![Non-Bank Financial Institutions and Private Credit Investment in Uzbekistan [2026 Update]](https://cdn.prod.website-files.com/625628af6992eb6ba8dd5c41/67bee8416ef9820506b5e8c8_nbfi-and-private-credit-investment-in-uzbekistan-thumbnail.avif)