Bottom Line
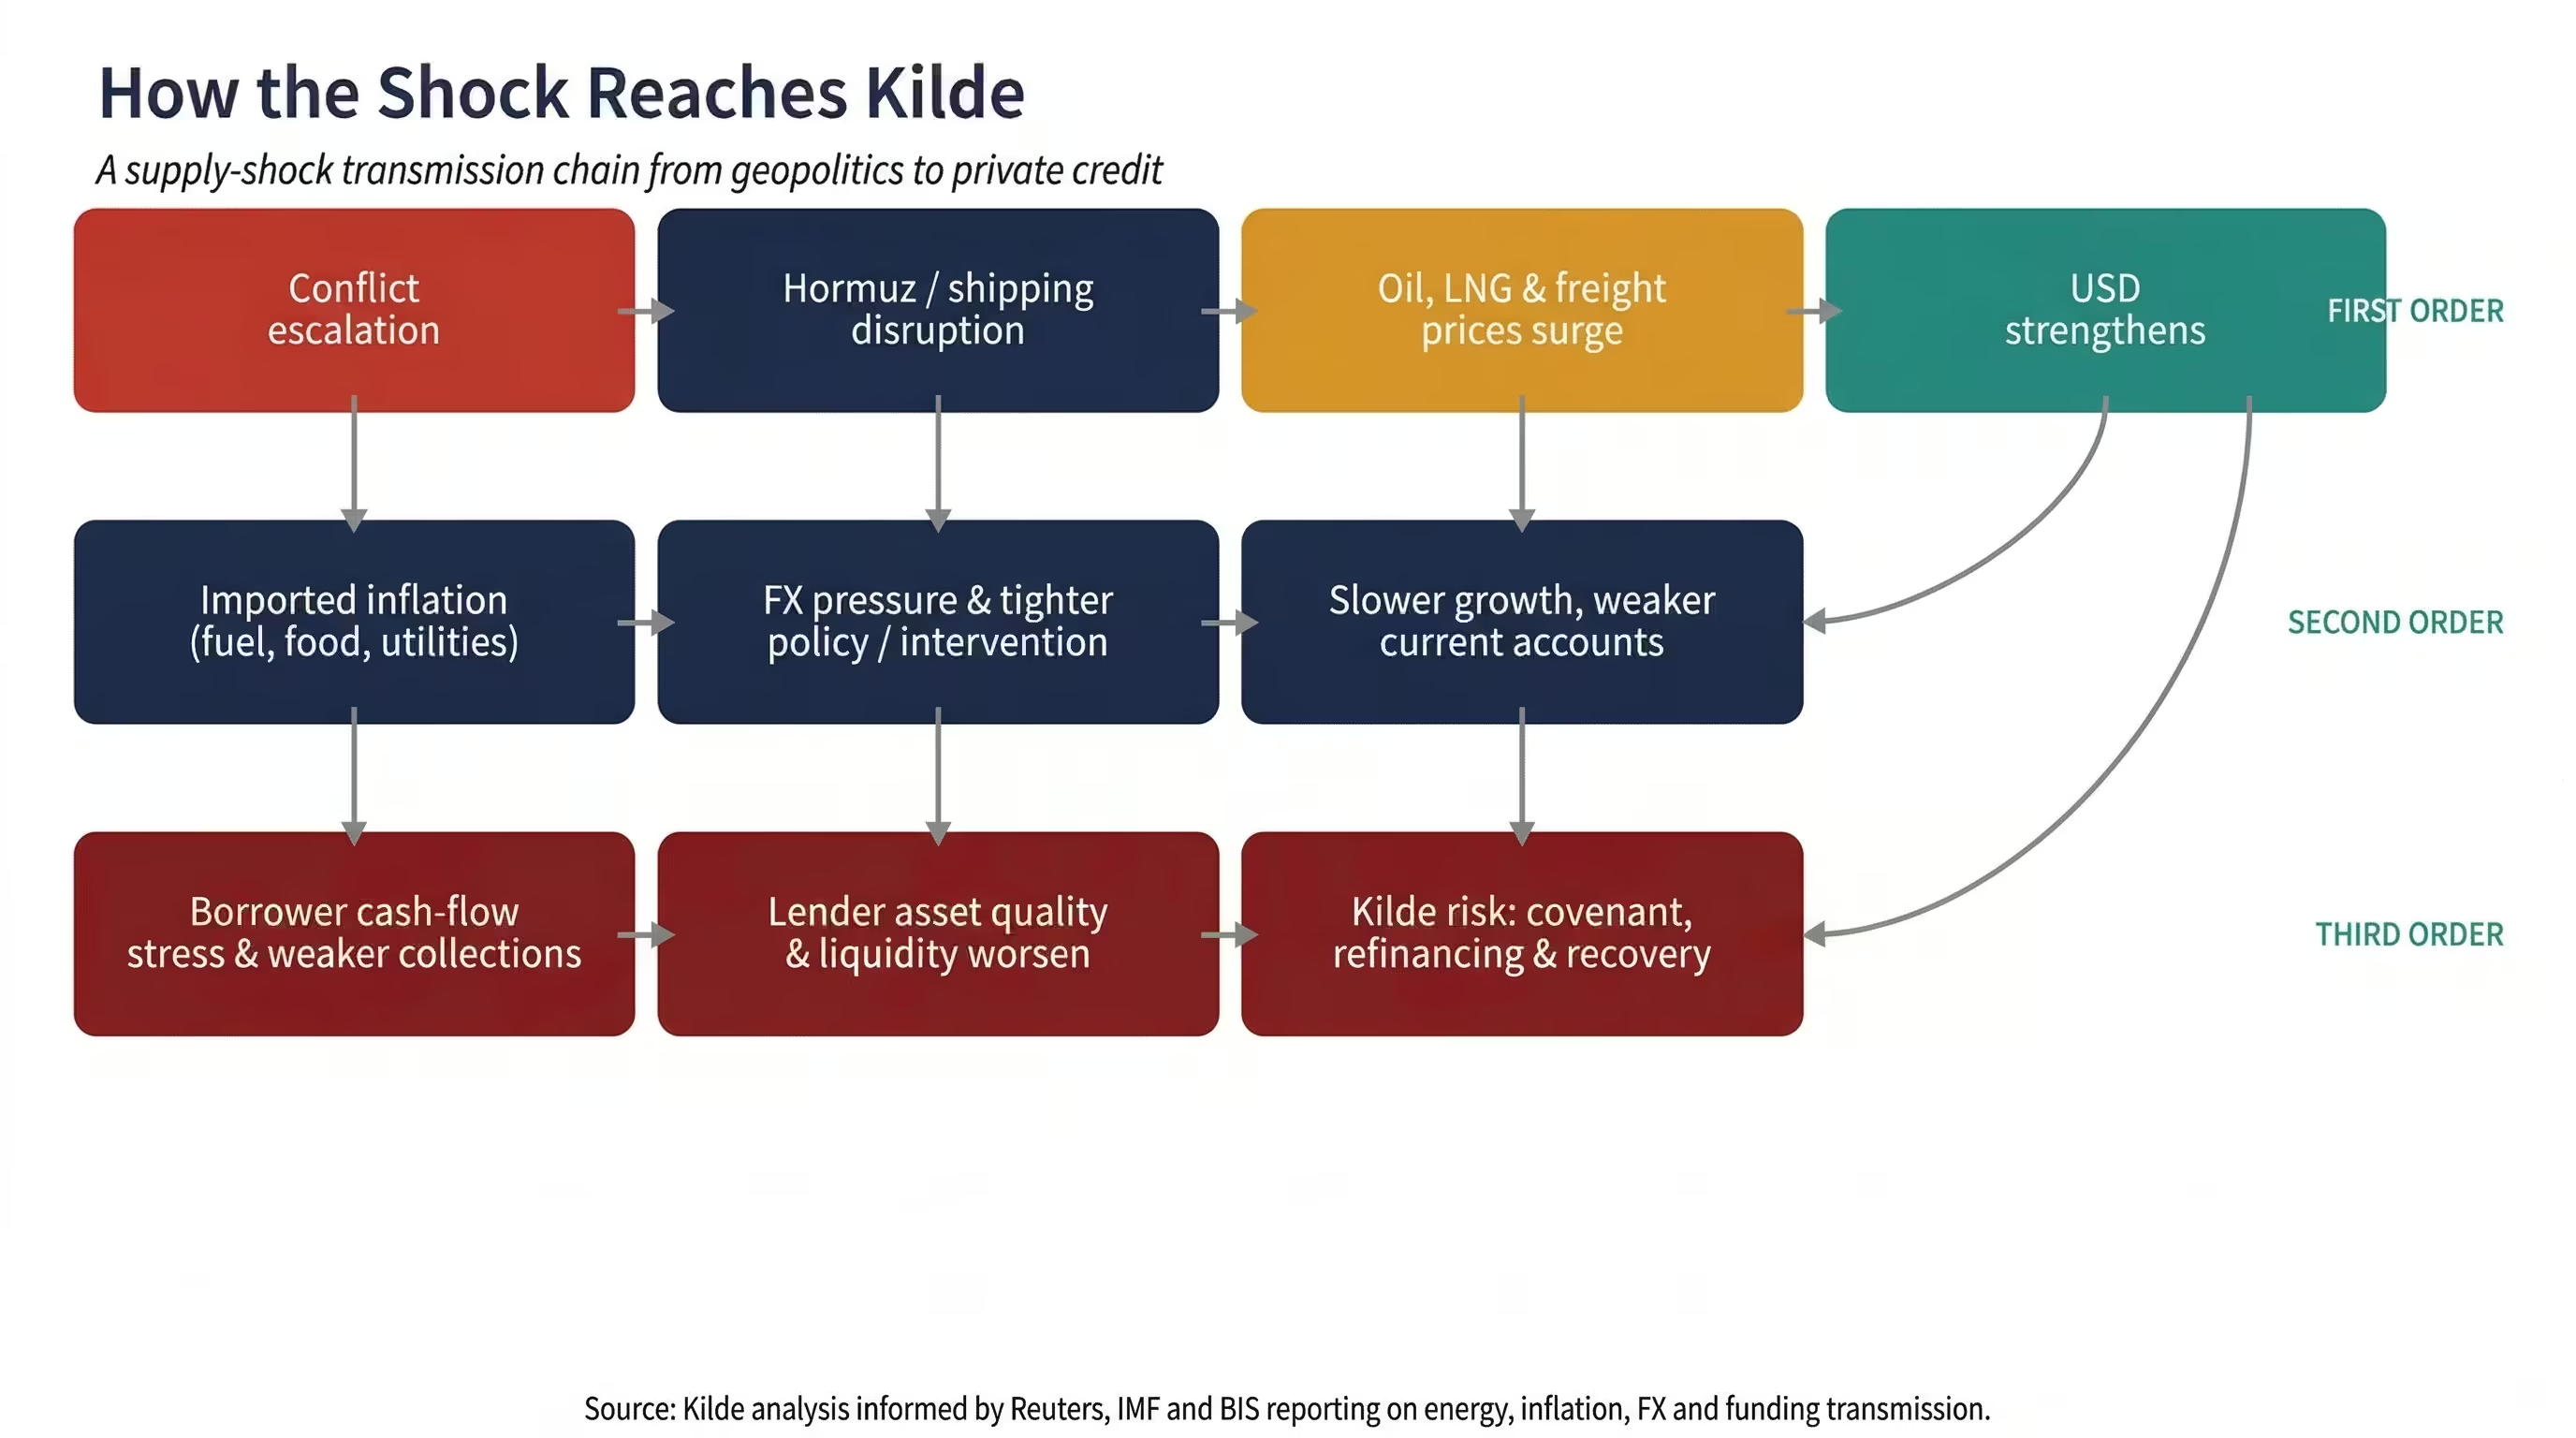
As of 24 March 2026, the Iran conflict has moved beyond headlines into shipping lanes, LNG facilities, insurance markets and central-bank reaction functions. The first-order effect is on energy prices. The second-order effect is on inflation and FX. The third-order effect is on credit quality, and that is where our portfolio requires close attention.
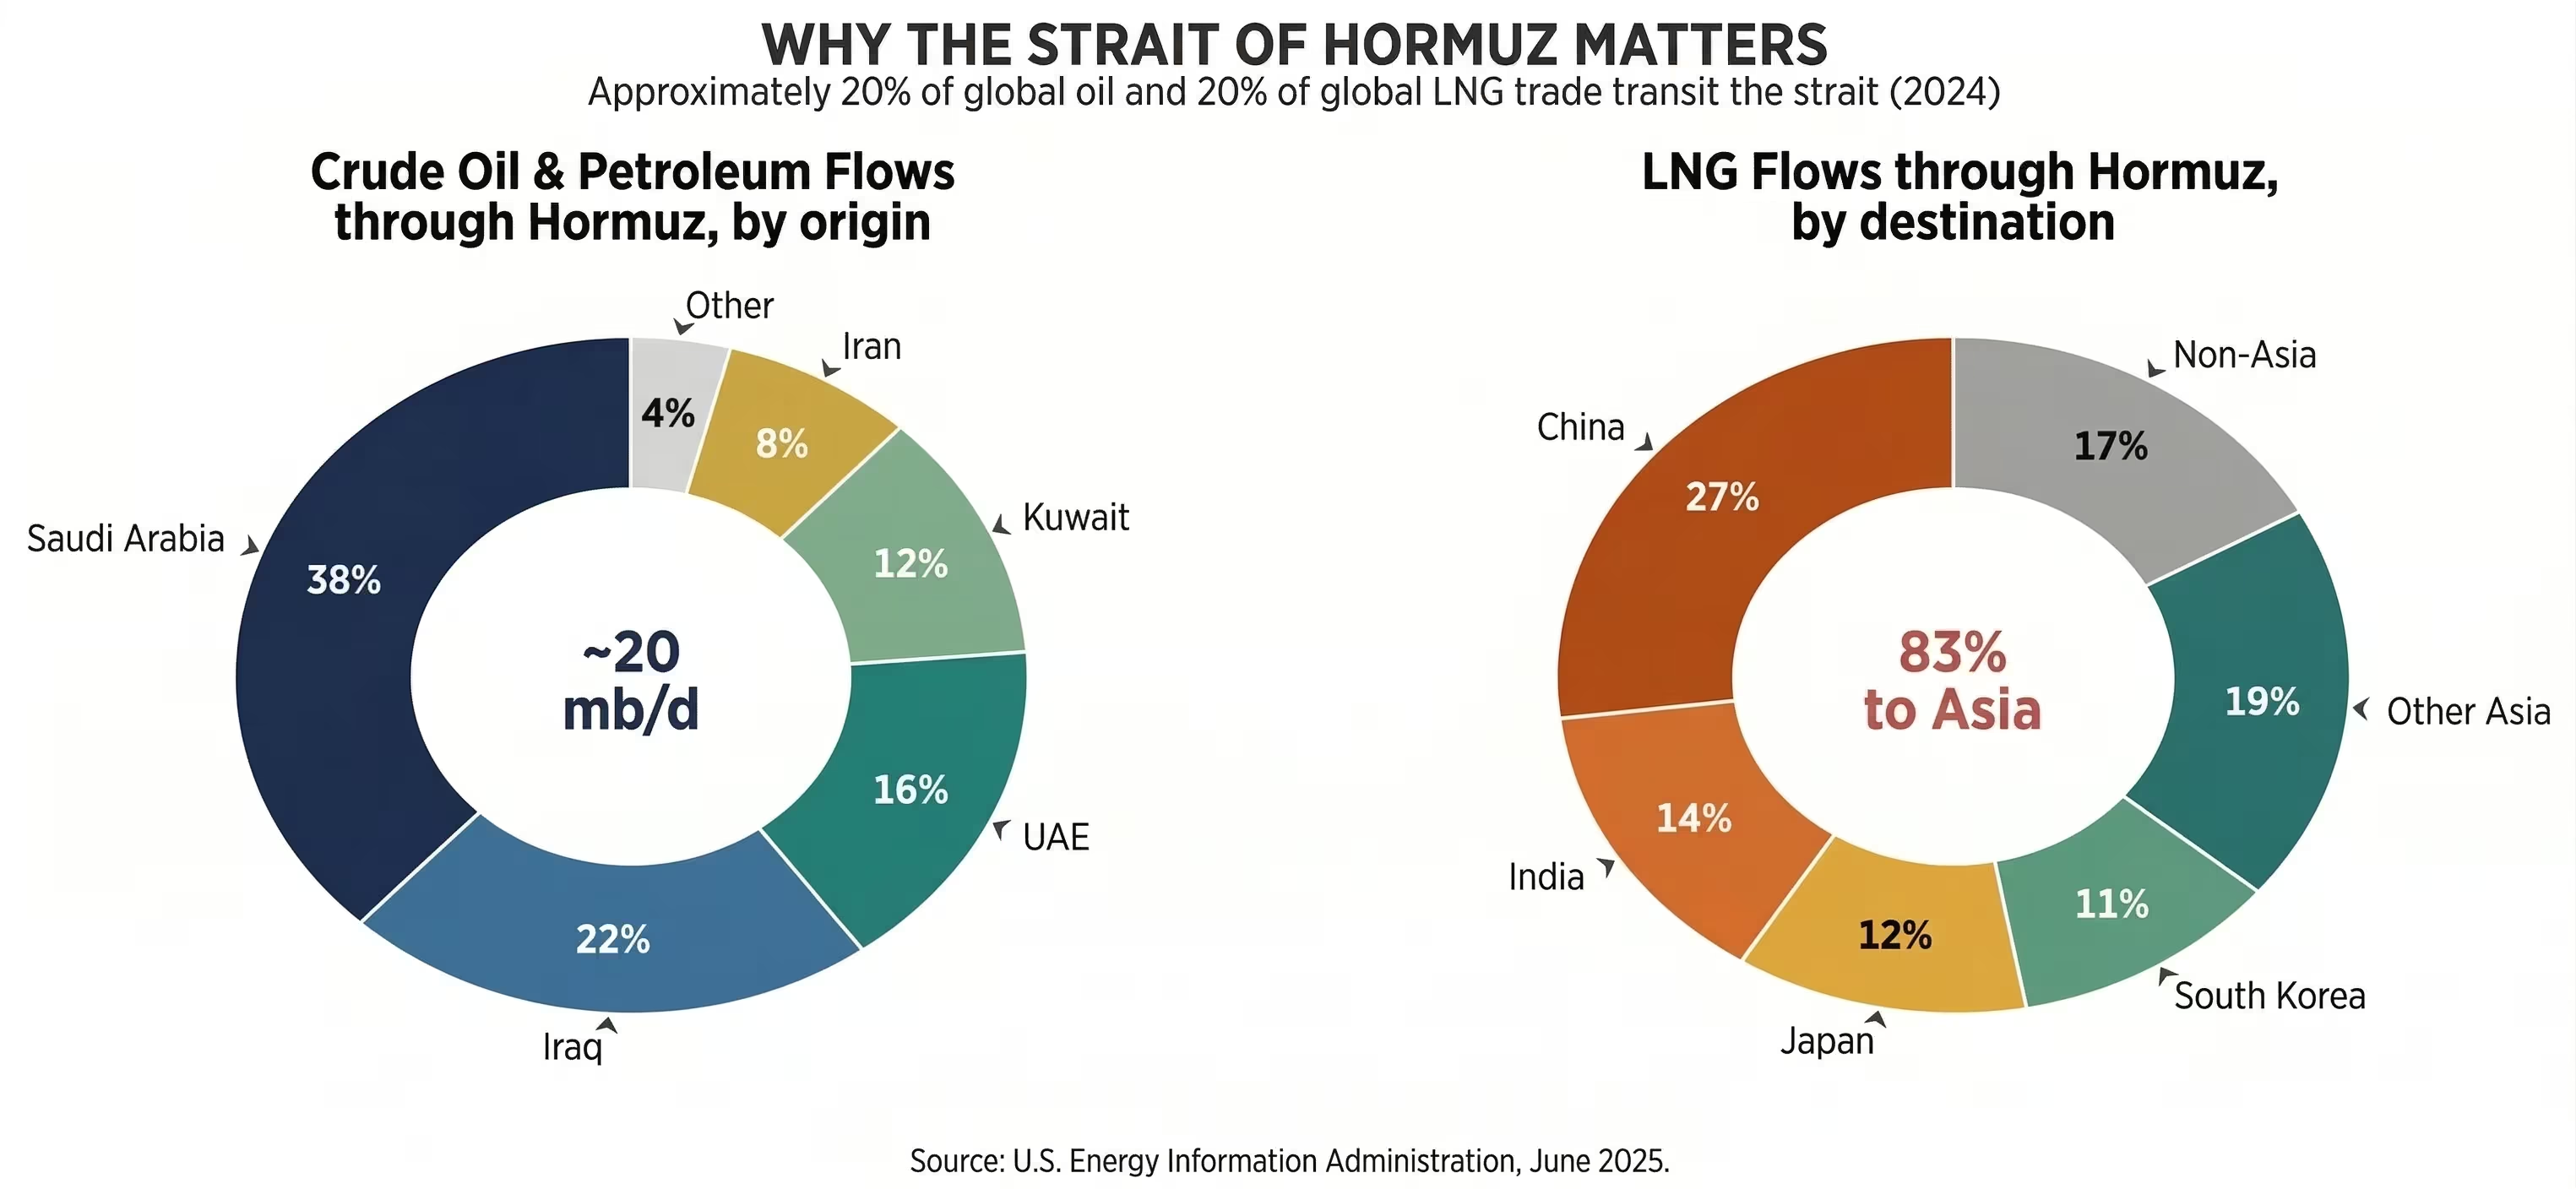
Hormuz matters because roughly 20% of global oil and 20% of LNG trade move through it, with Asian importers taking most of the LNG flow.
The primary shock is higher delivered energy prices and tighter financial conditions; the next wave is imported inflation, FX stress and weaker current accounts.
Our risk assessment: the key risk to our portfolio is not direct commodity exposure, we deploy in USD and are not directly affected by FX fluctuations. The risk is the transmission from local- currency borrower stress into our partner lenders’ collections and gross margins. In a scenario of a sustained disruption with the worst portfolio impact, our estimated at-risk value is approximately 15% of portfolio face value. Relative to the average investor return of approximately 12.4%, this means the stress scenario would eliminate roughly one full year of returns and, in a severe case, result in a partial loss of underlying capital. It is meaningful but absorbable, and we are taking active steps to manage it.
Our reaction: We are proactively rebalancing exposure to the most vulnerable borrowers while taking advantage of the market dislocation to further support the strongest borrowers in our portfolio with adjusted risk-based pricing.
1. What Is Happening
The situation in the Middle East has moved well beyond a typical geopolitical headline. What we are witnessing is a direct test of whether global energy and trade flows can continue to operate while conflict reaches into critical infrastructure.
The current phase began on 28 February 2026, when U.S. and Israeli strikes on Iran triggered a wider regional conflict. By 24 March, Washington was threatening strikes on Iranian power plants unless the Strait of Hormuz was fully reopened within 48 hours. Iran insisted that non-enemy-linked ships could still pass. Still, in practice, threats and attacks have kept most vessels from transiting, making Hormuz the central economic variable of the conflict.
The U.S. Energy Information Administration estimates that in 2024, roughly one-fifth of global oil and petroleum product consumption passed through the strait. Around one-fifth of global LNG trade also transited Hormuz, and 83% of that LNG was destined for Asian markets. This is therefore not only a Gulf story, but also an energy, inflation, and current-account shock for Asia and for every economy that imports fuel at scale.
What distinguishes this episode from prior Iran flare-ups is the shift from rhetoric to hard infrastructure and logistics disruption. Attacks, selective transit, insurance withdrawal and tanker avoidance are all interacting simultaneously. Once insurance, routing and cargo availability break down together, the event stops being a sentiment shock. It becomes a supply shock, and that is the scenario we are now monitoring closely.
2. First-Degree Effects: Energy, Logistics, Markets
Energy
Brent crude stood around $70 a barrel in the run-up to the 28 February strikes. By 19–20 March, it had moved into triple digits, briefly touching $119 intraday before settling near $112, a roughly 60% surge in under three weeks. On 23 March, Brent dropped sharply to $99.90 after reports that the White House had delayed planned strikes on Iranian energy infrastructure, prompting a brief risk-off reversal. By 24 March, prices had bounced back to $103.67 as markets reassessed the situation. European natural gas prices also spiked sharply as the market began pricing in physical disruption rather than geopolitical conflict.

Logistics
When vessels are damaged, insurers pull back, and cargoes accumulate outside a chokepoint, energy becomes harder to move, even before it becomes impossible to produce. This is why the conflict is hitting LNG, refined products and petrochemical feedstocks especially hard: the bottleneck is not production but transport.
Financial markets
Global equities have sold off, bond yields have risen, and rate-cut expectations have been pushed back. Policymakers are already flagging renewed inflation risk and a higher chance that central banks will need to stay tighter for longer. Even without outright rate hikes, this is enough to materially tighten financial conditions.

FX and emerging-market pressure
The dollar has reasserted itself as a haven, while import-sensitive emerging-market currencies have come under heavy pressure. The Indian rupee has weakened past ₹93 per dollar to a record low; the Korean won, Indonesian rupiah, and Philippine peso have also depreciated sharply. Higher oil prices widen current-account deficits, complicating reserve management and forcing central banks to choose between defending the currency and supporting growth.

3. Secondary Effects: Inflation, External Accounts, Credit
Inflation transmission
Higher oil and gas prices feed directly into fuel, freight and electricity, but they also propagate through fertilisers, plastics, chemicals and food. The IMF warned on 19 March that disrupted fertiliser shipments and transportation were already raising the risk of substantial food-price increases if the conflict persisted.
For emerging markets, the inflation hit is disproportionately severe. IMF First Deputy Managing Director Gita Gopinath noted in May 2025 that oil-price shocks tend to hit core inflation in emerging-market economies more than twice as strongly as in advanced ones. Once the shock migrates into wages, administered prices and expectations, it becomes far harder to reverse.
External accounts
Import-dependent economies are paying more for the same energy, typically in dollars. That weakens current accounts, pressures reserves and raises the political cost of orthodox monetary policy. India is an instructive example: the Middle East supplies 55% of its crude, and one brokerage estimated that every $10 rise in oil widens India’s current-account deficit by 0.5% of GDP, adds roughly 35 basis points to inflation and trims growth by 15–20 basis points.
Eastern Europe and Central Asia: a critical channel
The impact on Eastern Europe’s emerging markets warrants particular attention, as our portfolio has 50% exposure to EM Europe. Many of these economies, including those in the Balkans, the Caucasus and parts of Central and Eastern Europe, are net energy importers with limited strategic reserves. They face a triple squeeze: higher imported energy costs eroding household purchasing power, tighter global financial conditions limiting access to external capital, and currency depreciation raising the domestic cost of dollar-denominated obligations.
The EBRD warned in mid-March that it was already considering support programmes for businesses across Eastern Europe, Central Asia, and parts of the Middle East and Africa, as the war was spilling into energy, food, and financial conditions. Countries such as Georgia, Armenia, Moldova, North Macedonia and Serbia, which depend on imported gas and refined products, are especially vulnerable. Our partner lenders in these markets are likely to see weaker collections, higher provisioning needs and thinner capital buffers before the headline oil price directly affects their underlying borrowers.
For Central Asian economies such as Kazakhstan and Uzbekistan, the picture is more nuanced. Sovereign revenues may benefit from higher commodity prices, but our partner lenders are exposed to domestic borrowers whose incomes are denominated in local currency. Higher food and fuel costs squeeze household affordability and SME margins, regardless of the sovereign balance sheet.
4. Tertiary Effects: What Happens if the Conflict Is Sustained
Persistent inflation regimes
If the conflict persists, third-order effects become more dangerous than first-order ones. The concern shifts from higher oil to whether repeated supply shocks and currency weakness push economies into a more persistent inflation regime.
BIS research makes two points that matter here. First, supply-driven commodity shocks create a policy trade-off because they raise inflation while weakening output, which is why central banks usually respond more cautiously to supply-driven inflation than to demand-driven inflation. Second, once inflation becomes generalised, economies can shift into a high-inflation regime in which prices respond more strongly to one-off commodity spikes and exchange-rate depreciation.
A permanent risk premium
A sustained conflict would also hard-wire a larger geopolitical risk premium into the world’s energy system. Gulf energy markets will carry a higher Middle East risk premium for years because insurers, shipowners and buyers do not immediately revert to normal once a route has proved vulnerable. Even if Hormuz is formally reopened, convoy requirements, higher insurance, rerouting and precautionary stock-building would all keep delivered energy costs above the old equilibrium.
Financial stability
The financial-stability angle is underappreciated. ECB and BIS officials have warned that non-banks and opaque private markets can amplify abrupt repricing when uncertainty is high and liquidity is thin. A BIS analysis published in March 2026 adds that emerging markets with greater unhedged foreign funding and shallower FX markets face greater difficulty in absorbing external shocks.
5. Our Position and Strategic Response
Why are we not directly exposed, but our borrowers are
We deploy capital in USD and receive fixed monthly cash coupons in USD. The strategy is not directly affected by local-currency fluctuations. On the contrary, the dollar has strengthened against the Singapore dollar over the past 30 days, which is a tailwind for the fund. We do not hold oil or commodity exposure.
The risk sits one level below. Our partner lenders earn in local currency, tugrik, rupiah, rupee, zloty, tenge, but service USD-denominated obligations to us. Two transmission channels matter. First, local-currency depreciation against the dollar: for the unhedged portion of the portfolio, FX weakness raises the real cost of USD debt service and, if severe enough, can create solvency issues for borrowers. Second, the rising cost of living, as measured by the CPI: higher energy and food prices erode household purchasing power, increase delinquencies in underlying loan books, and compress the gross margins of our partner lenders.
How are we responding
We will continue deploying capital through the crisis. Our strategy is not to stop lending but to concentrate deployment on the strongest borrowers in the portfolio, those with the highest gross margins, the most robust collections infrastructure and the most resilient business models. These borrowers are best positioned to absorb both the short-term energy-price shock and the longer-term effects of sustained inflation, currency weakness and tighter financial conditions.
If the supply shock proves to be sustained, we will begin reducing exposure to the most vulnerable markets. The priority list for reduction is Mongolia, India and Indonesia, the three largest exposures that rank highest on either the immediate-disruption or sustained-shock vulnerability scales. Reductions would be managed through natural roll-off and selective non-renewal rather than forced liquidation, preserving borrower relationships and avoiding unnecessary loss crystallisation.
In parallel, we will carefully hedge our USD exposure back to SGD to protect against potential spikes in currency volatility. While the USD/SGD move has been favourable so far, the geopolitical environment warrants active management of this position.
Putting the risk in context
The stress test in Section 6 estimates our portfolio’s at-risk value at approximately 15% of face value under a combined immediate-shock and sustained-supply-shock scenario, roughly $25 million on a $165 million portfolio. Relative to the average investor return of approximately 12.4%, this means the risk would result in a one-year loss of return and at least a partial loss of underlying capital. It is a meaningful but absorbable stress: it does not threaten the portfolio’s structural integrity, and it can be managed through the combination of selective de-risking, margin-focused borrower selection and active FX hedging described above.
6. Borrower-Level Stress Test: FX, Inflation Vulnerability, Repayment Wall
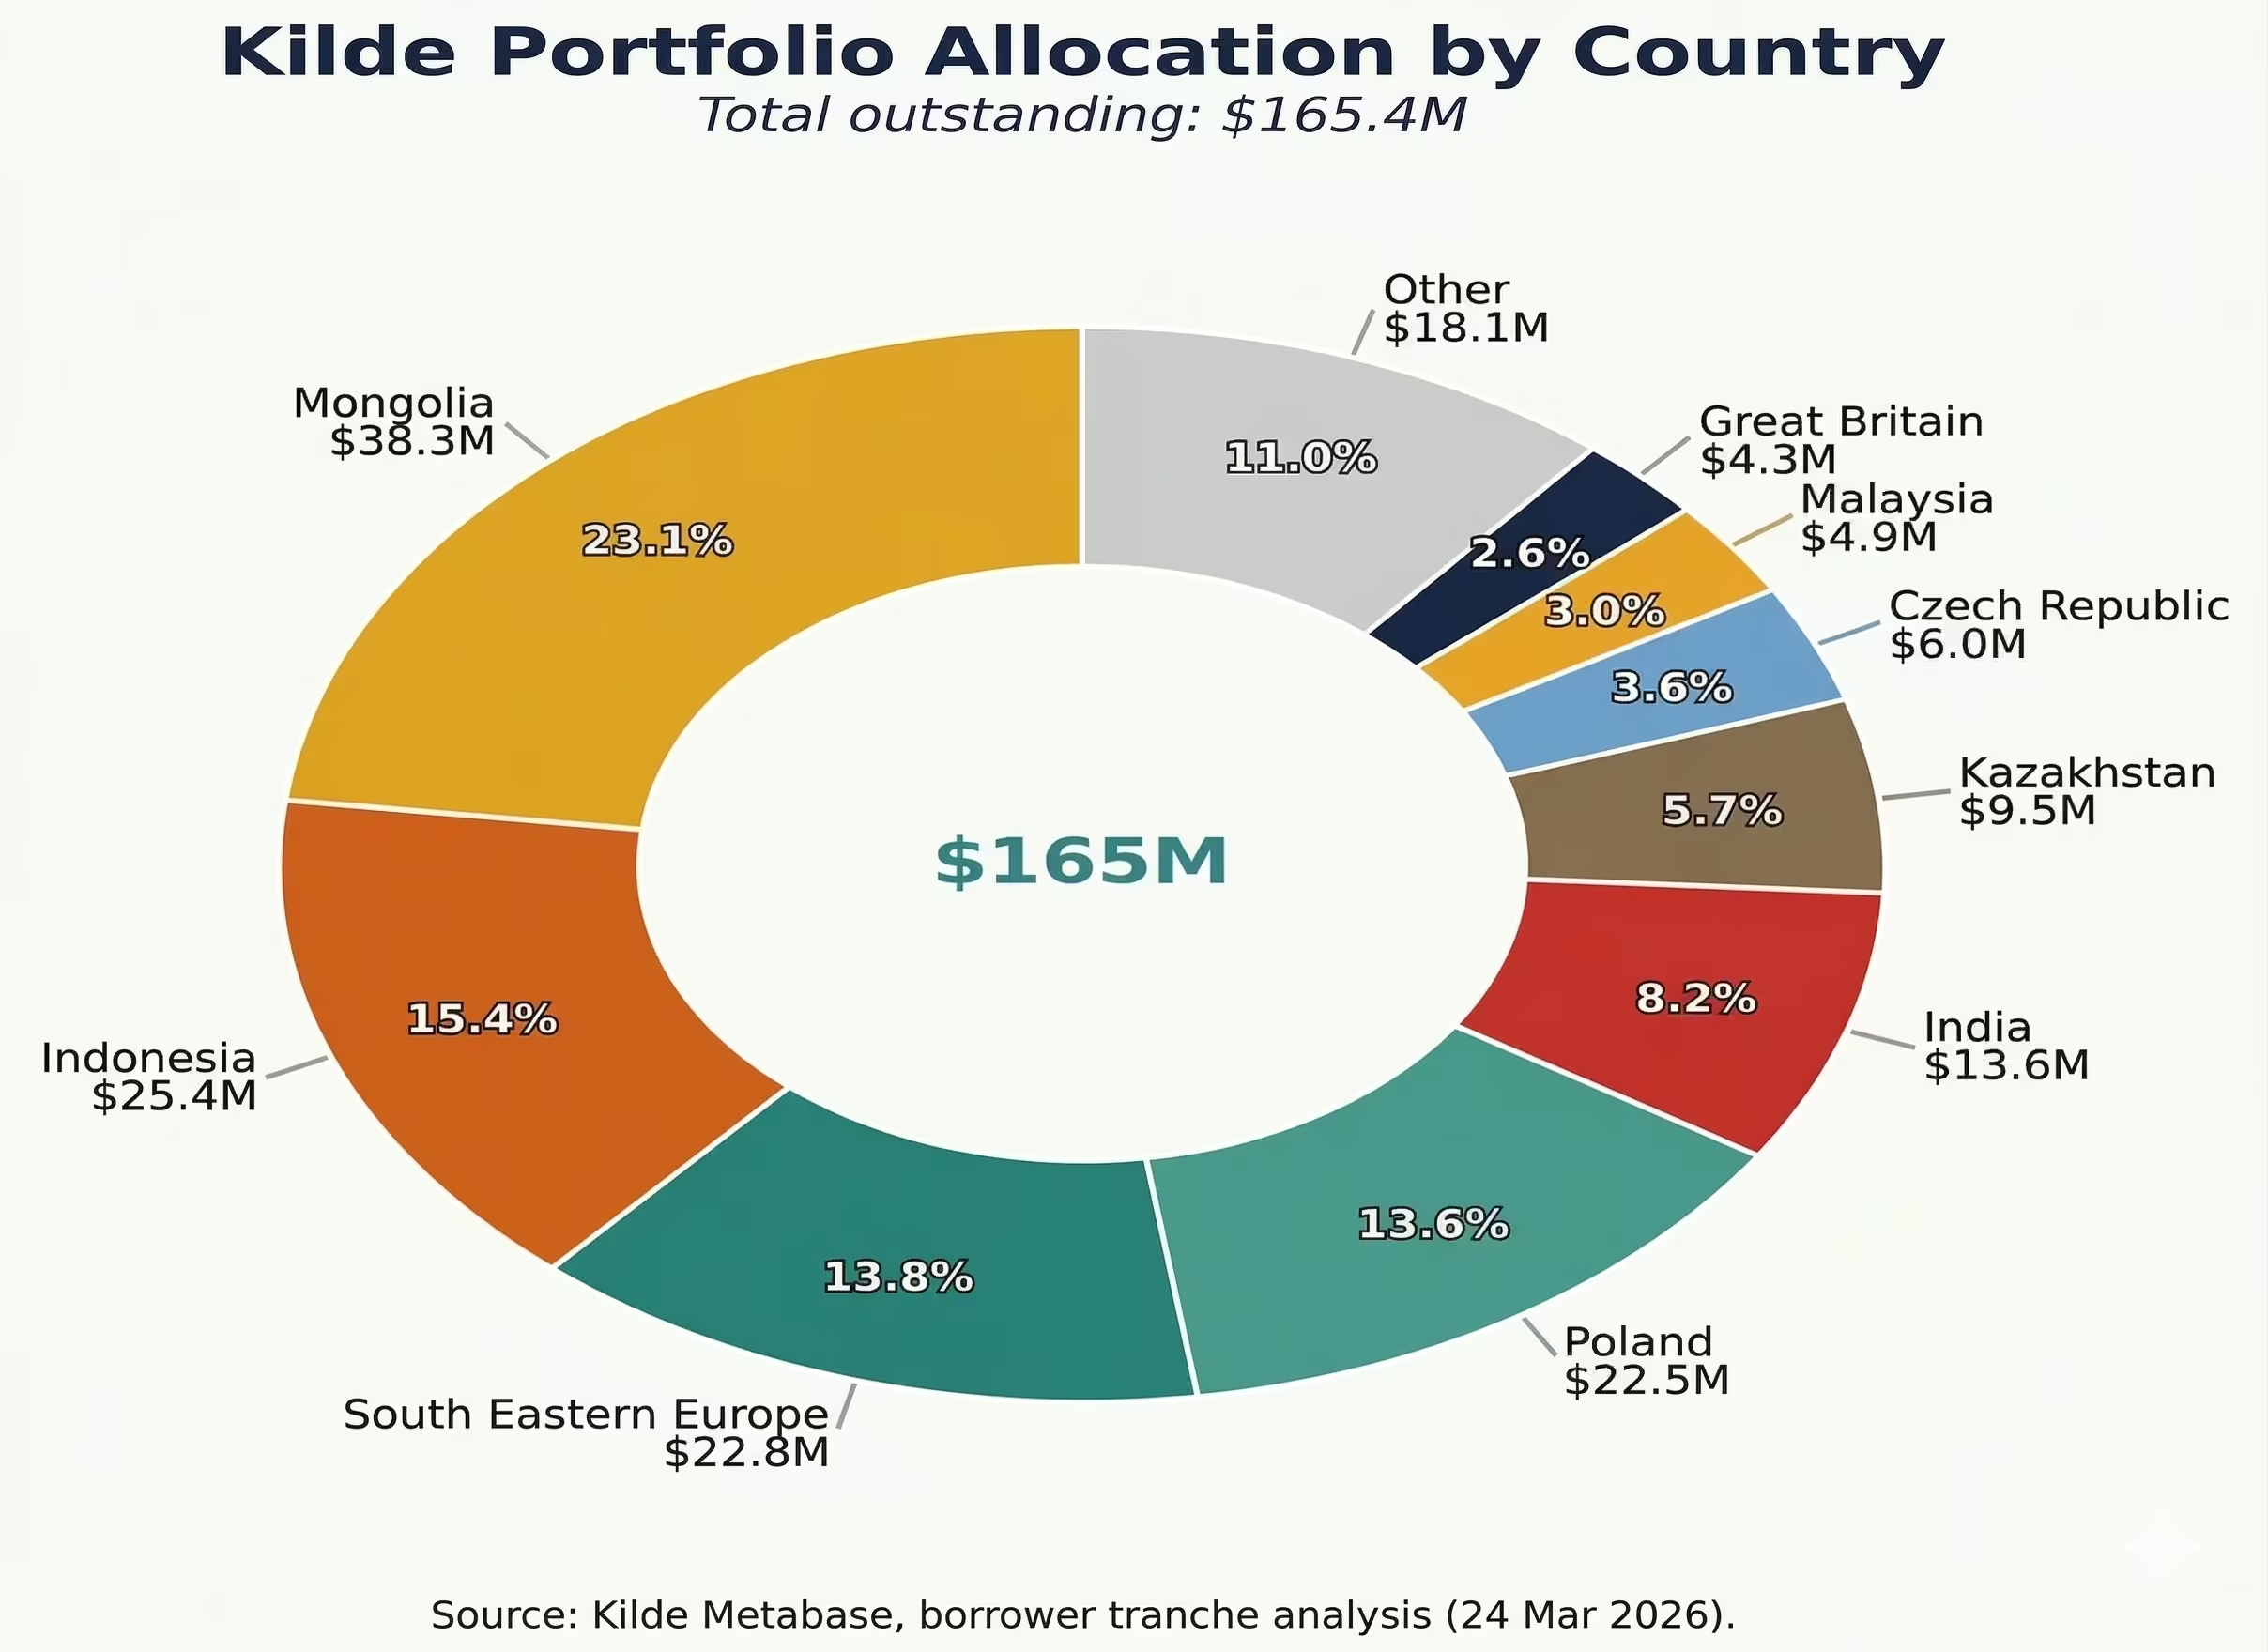
Our portfolio totals $165 million across ten country/region buckets. All borrowers earn in local currency but repay us in USD, creating an inherent FX-mismatch risk. However, the transmission mechanism differs sharply depending on whether the Hormuz disruption remains an acute energy-supply event or develops into a sustained global price shock. We therefore split the analysis into two scenarios. At the time of writing this article, scenario A is likely unfolding before our eyes. The occurrence of scenario B depends on the duration of the conflict and the consequences after the conflict ends.
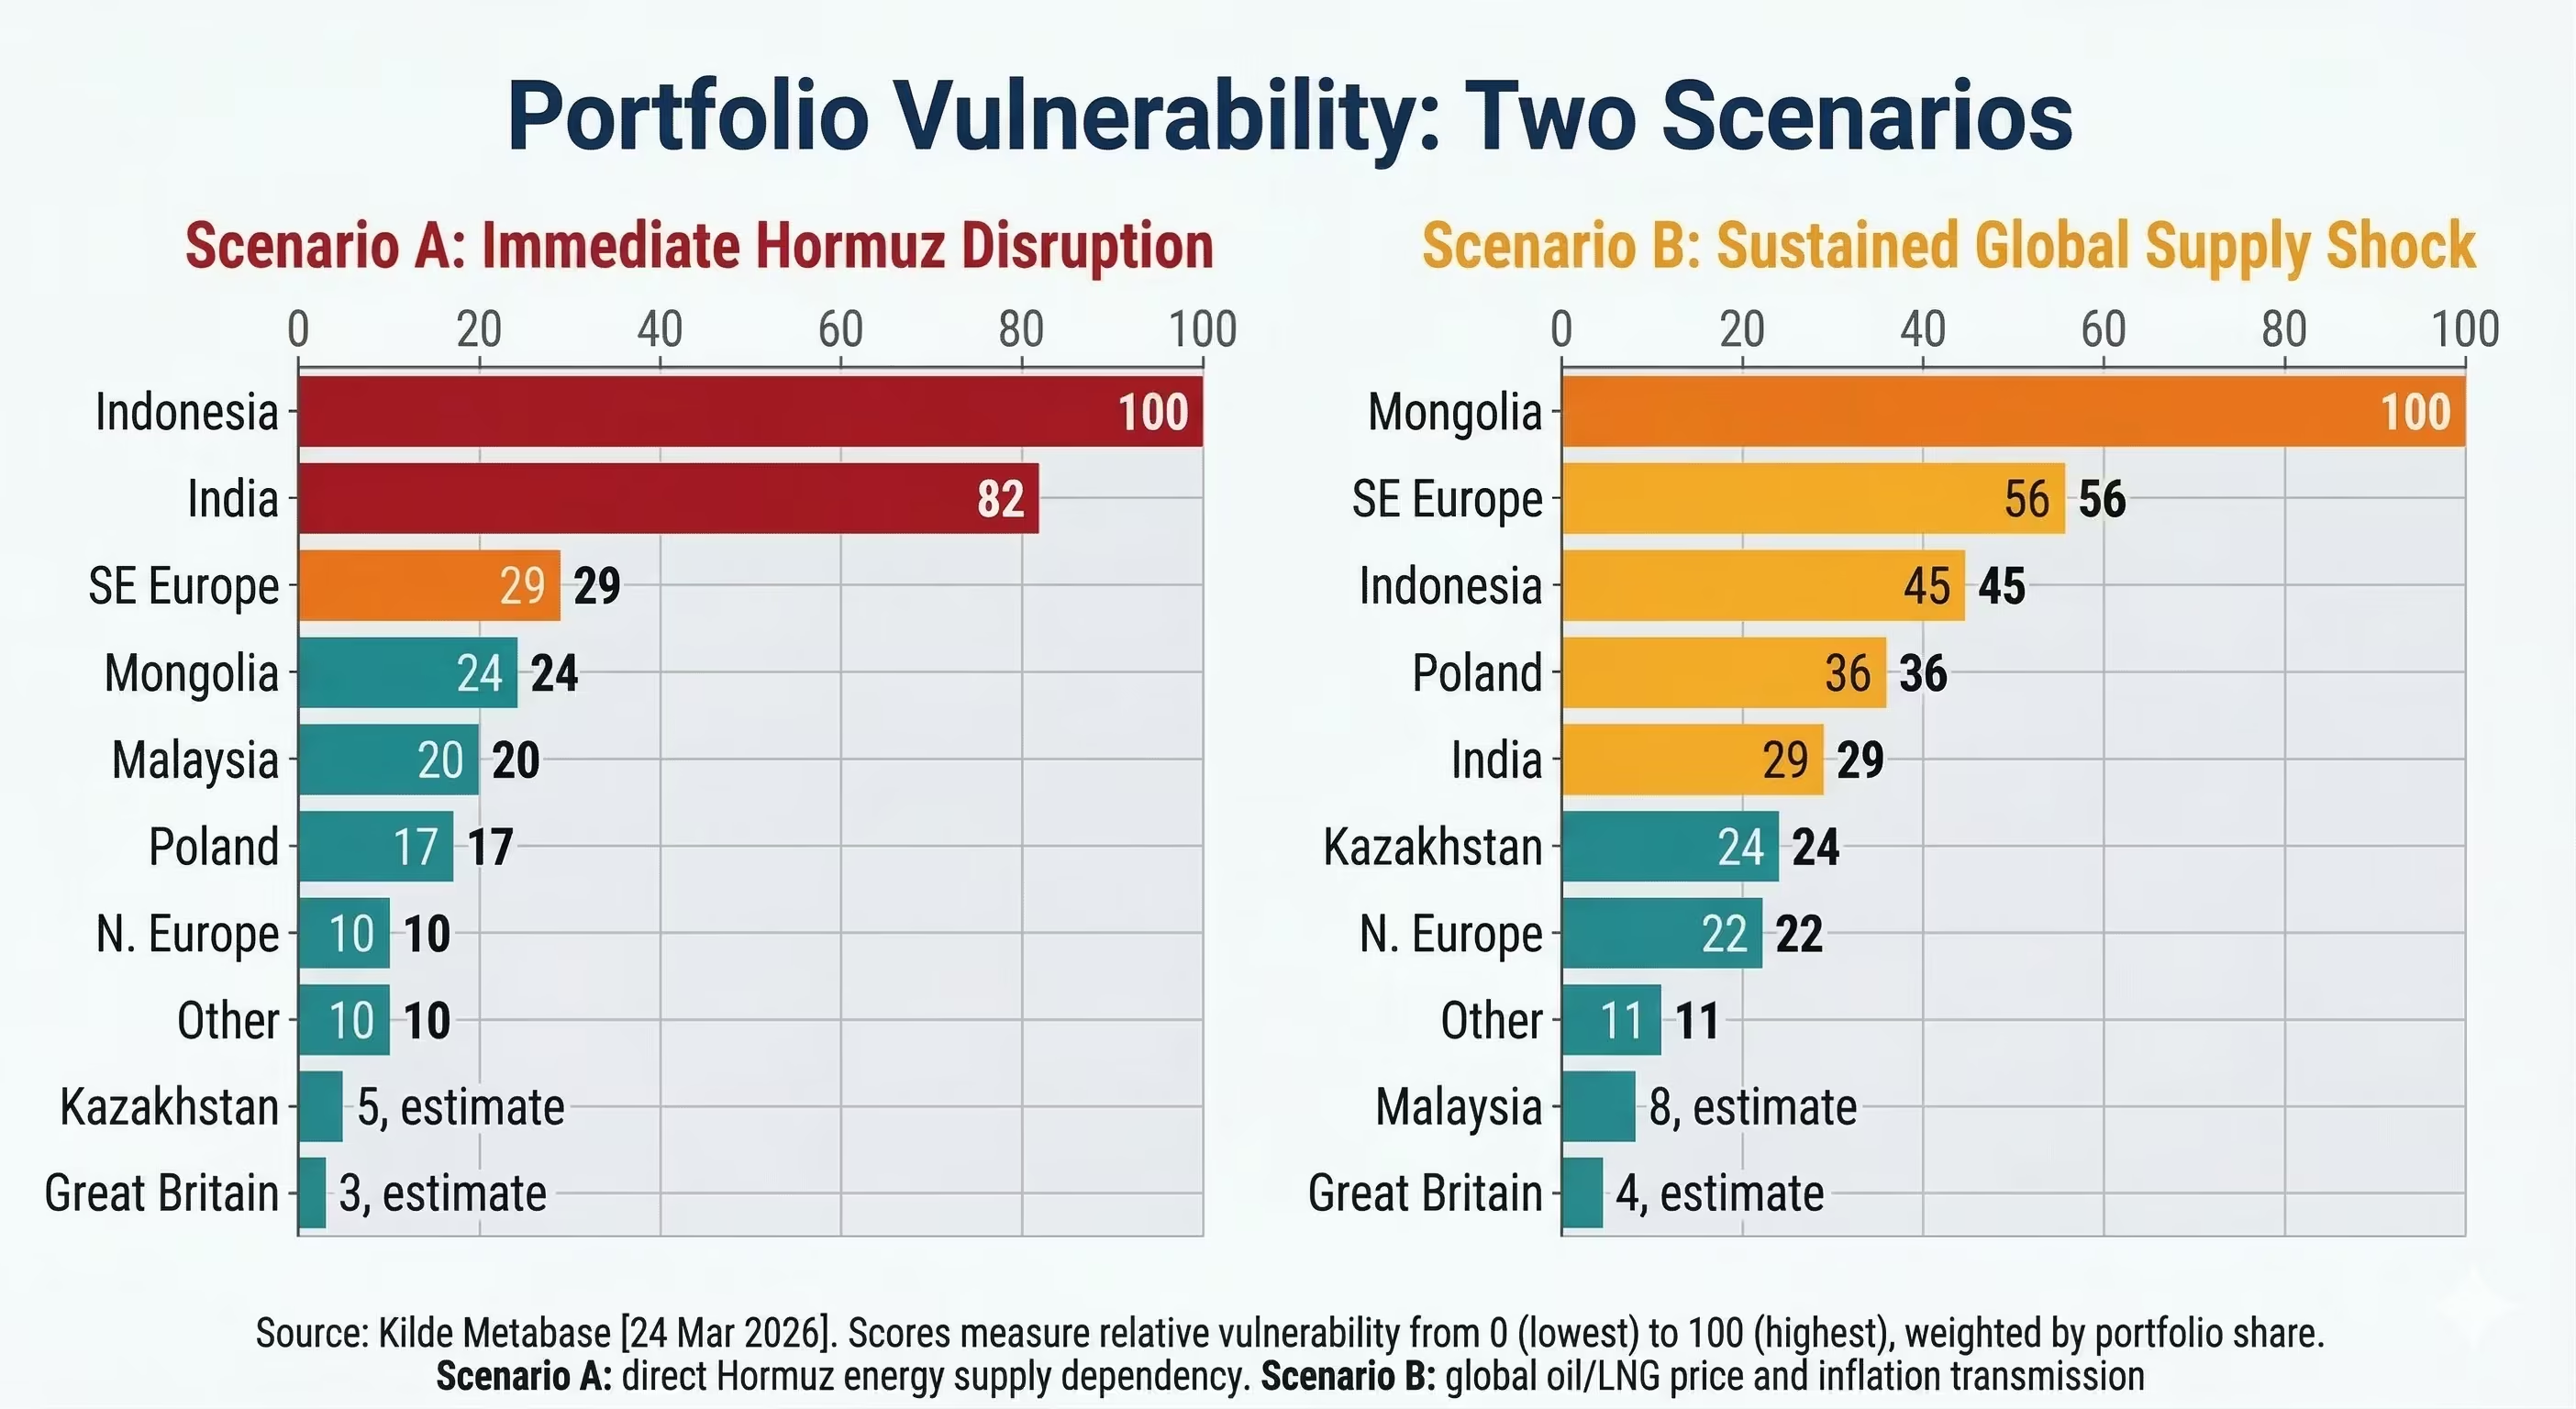
Scenario A: Immediate Hormuz disruption
This scenario captures countries whose energy supply chains run directly through the Strait of Hormuz. The impact is immediate: physical supply disruption, cargo unavailability, insurance withdrawal and sharp currency depreciation as current-account deficits widen overnight.
India is the most directly exposed market in our portfolio. The Middle East supplies the majority of India’s crude; the rupee has already depreciated sharply to a record low past ₹93/$. Rising oil prices widen the current-account deficit, add to inflation and trim growth. Foreign investors have pulled billions from Indian equities in March alone, intensifying capital outflows.
Indonesia is a net energy importer with meaningful Middle East crude and LNG procurement. The rupiah has weakened modestly so far, but inflation has already jumped above the central bank’s target corridor, and Bank Indonesia has held rates at elevated levels to defend the currency. If Hormuz remains restricted, Indonesia’s subsidy regime and fiscal position come under pressure simultaneously with our borrowers’ affordability.
Malaysia has a smaller exposure with lower immediate risk. Malaysia became a net oil importer around 2014 and buys LNG from the Middle East, but its deeper capital markets and lower inflation provide more cushion. This is a monitoring position, not an immediate concern.
Scenario B: Sustained global supply shock
This scenario captures countries that are not directly dependent on Hormuz energy flows but would be hit by a prolonged conflict that keeps global oil and LNG prices elevated for months. The transmission is slower but potentially more damaging: global commodity price pass-through into domestic CPI, eroded household purchasing power, weaker collections and tighter local funding conditions.
Mongolia is our single largest exposure and the clearest example of why the two scenarios need to be separated. Mongolia imports oil from Russia, not through Hormuz, so it is not immediately vulnerable to a strait closure. However, a sustained global oil price shock would raise the cost of Russian crude (which reprices to global benchmarks), push already elevated CPI (6.8%) even higher and squeeze borrowers whose incomes are denominated in tugrik. The tugrik is a thin, commodity-sensitive currency; a sharp move could develop quickly if the conflict drives a sustained repricing of global energy costs.
South Eastern Europe is our second-largest Scenario B exposure. Many of these economies, Georgia, Moldova, and the Western Balkans, import gas via pipelines or spot LNG that reprices to global benchmarks. A sustained shock would raise domestic energy and food costs, weaken currencies against the dollar (the Serbian dinar and Bulgarian lev have already depreciated by roughly 3%), and tighten the financial conditions under which our partner lenders operate. The EBRD’s early move to consider support programmes signals that stress is already becoming visible.
Poland imports gas from Norway and US LNG rather than through Hormuz, but global price linkage means a sustained conflict would push European wholesale gas prices higher. Inflation is currently low at 2.1%, but the zloty has already weakened 2.8%, and the NBP rate at 5.75% leaves less room for easing. Poland is a medium-risk exposure under Scenario B.
Kazakhstan illustrates a different risk channel. As a commodity exporter, the tenge has actually appreciated by 2.8% over the 30-day window, but inflation is running at 11.7%, and the policy rate is 18%, the highest in the portfolio. Under sustained shock, sovereign revenues may hold up while borrowers suffer: higher food and fuel costs squeeze household affordability and SME margins, regardless of the sovereign balance sheet.
Northern Europe, Great Britain, and other countries in the portfolio carry the lowest vulnerability across both scenarios. Deep capital markets, better hedging infrastructure, and lower energy import dependency provide significant cushioning, though no market is fully immune to a sustained global repricing.
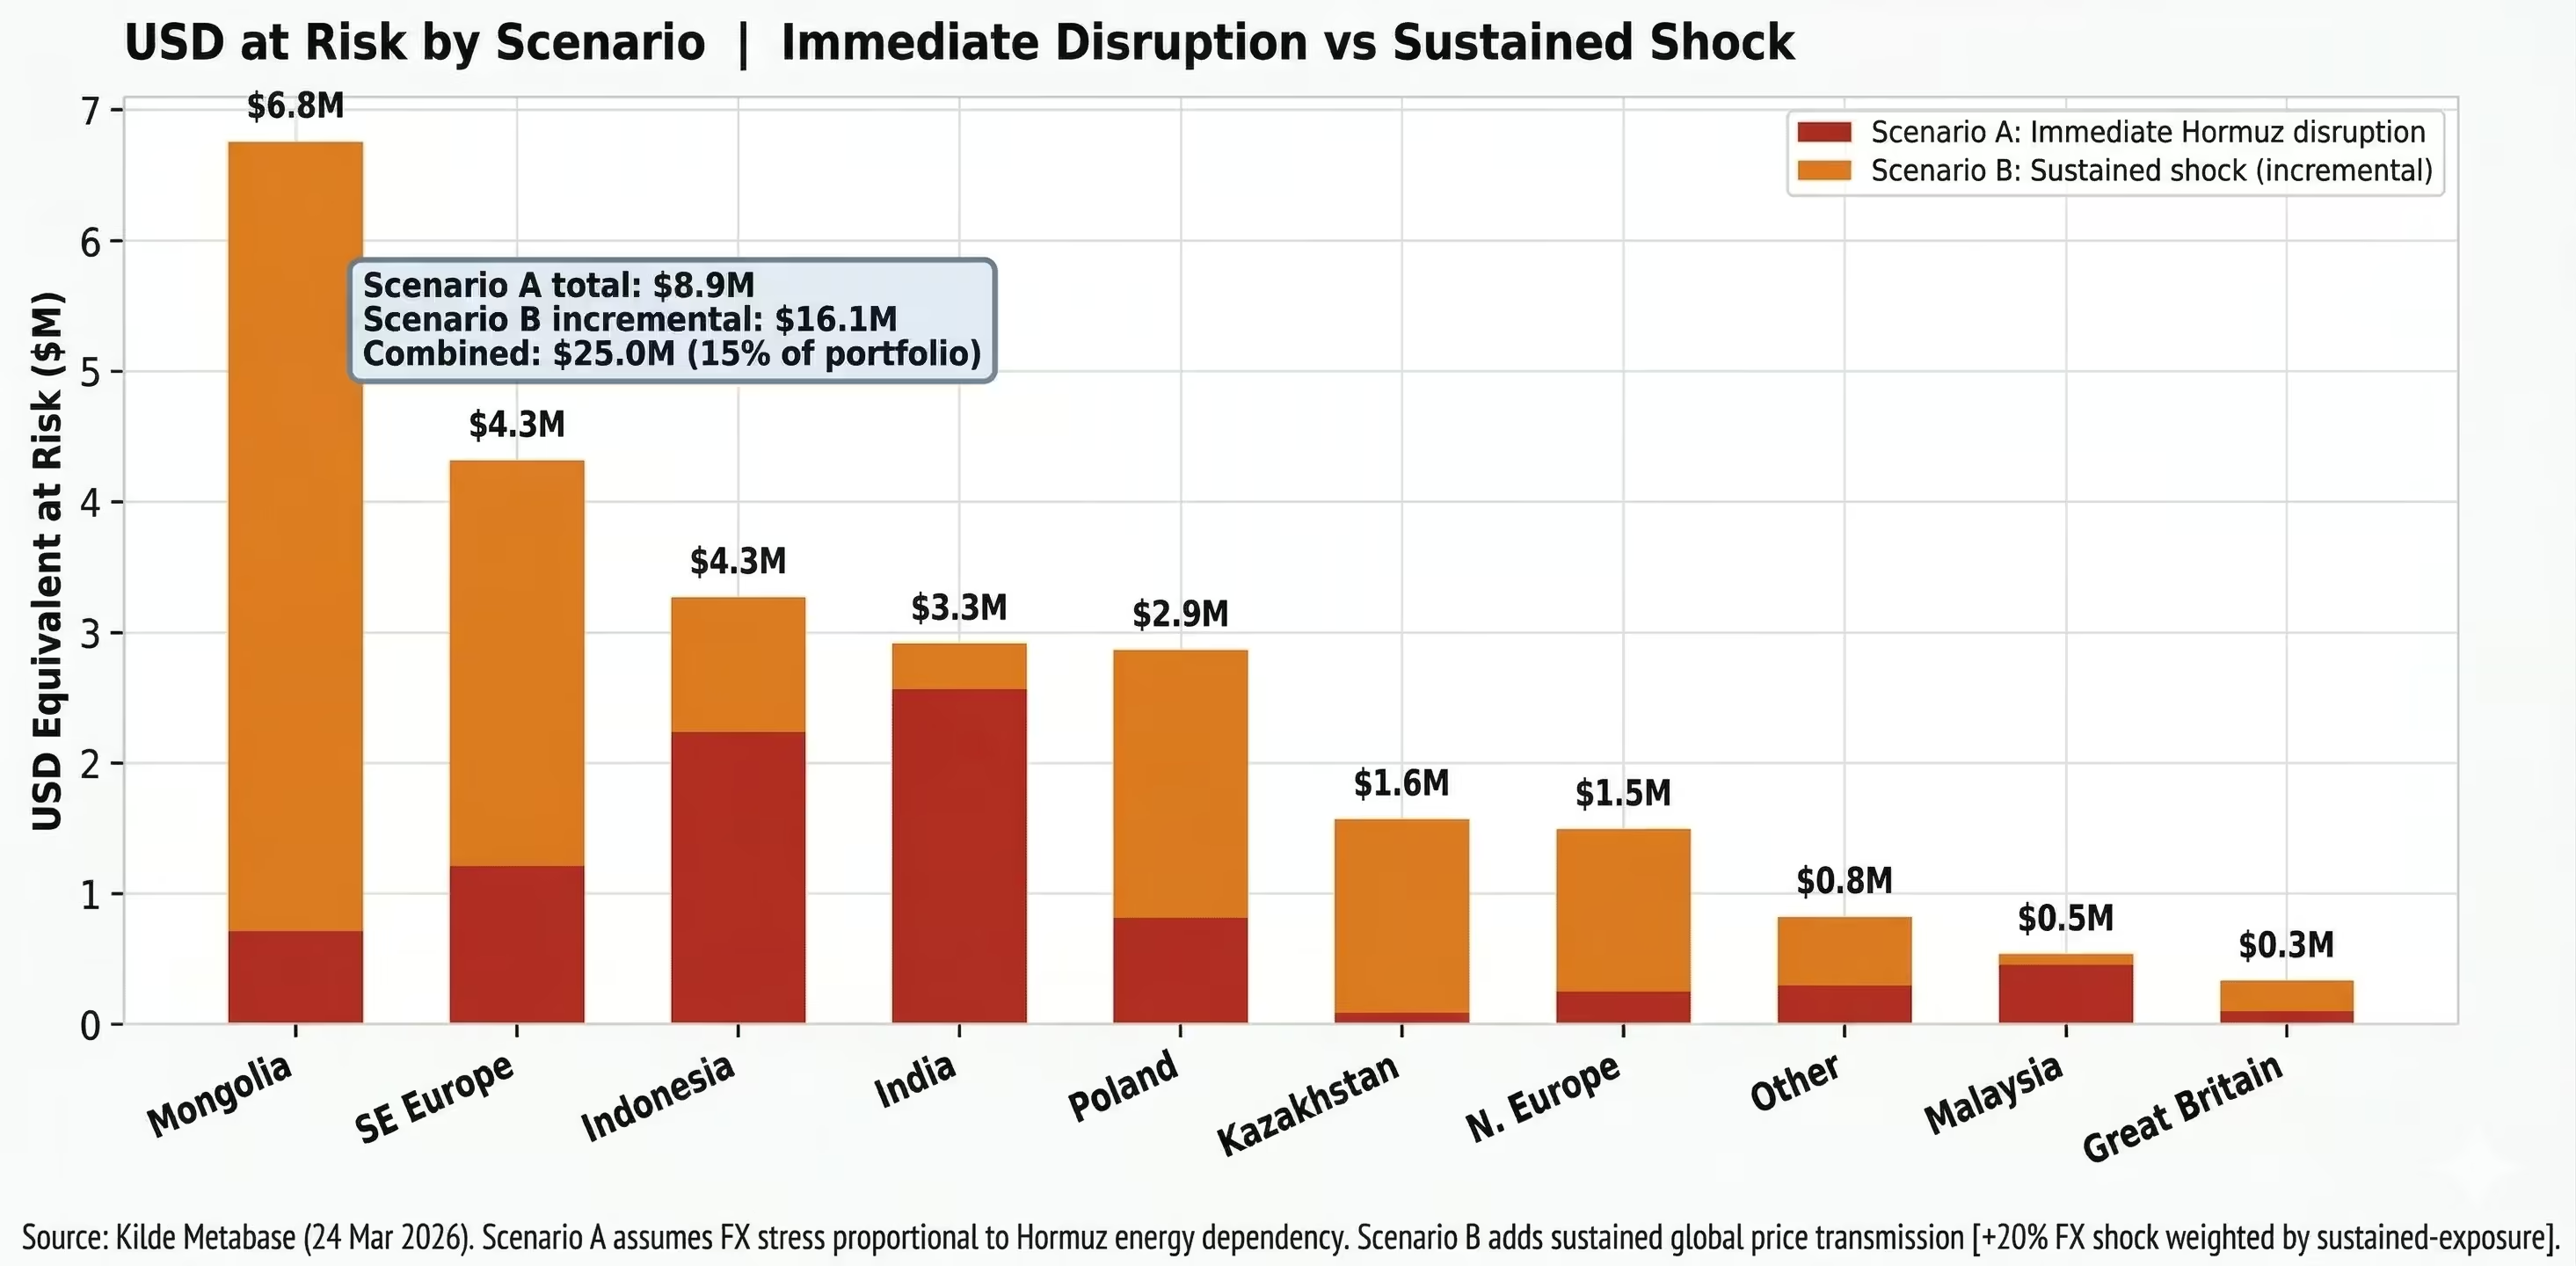
USD at risk: layering the two scenarios
The stacked chart below shows USD at risk under each scenario. Scenario A (immediate Hormuz disruption) generates approximately $8.9 million of FX-driven stress, concentrated in Indonesia, India and Malaysia. Scenario B (sustained shock) adds an incremental $16.1 million, dominated by Mongolia ($6.0M incremental), South Eastern Europe ($3.1M) and Poland ($2.0M). The combined stress exposure is $25.0 million, or 15% of the portfolio.
This framing makes the action priorities clearer. For Scenario A names, India, Indonesia, and Malaysia, the response is immediate: faster FX-mismatch reporting, covenant monitoring and dialogue with lenders on hedging. For Scenario B names, Mongolia, South Eastern Europe, and Poland, the response is to prepare: set early-warning triggers on CPI and collection data, pre-negotiate tighter structural protections and slow origination in lenders whose underwriting assumes stable local-currency purchasing power.
FX depreciation vs inflation: cross-scenario risks
Two dimensions drive borrower stress across our portfolio: currency depreciation (which raises the real cost of USD repayment) and domestic inflation (which erodes borrower cash flows and collection rates). Scenario A markets, principally India, sit in the high-depreciation zone, where the rupee’s sharp weakening creates immediate FX-mismatch pressure. Scenario B markets, Mongolia and Kazakhstan, sit in the high-inflation zone, where domestic price pressure would intensify under a prolonged conflict.
The most dangerous outcome would be a market crossing from one stress zone into both, with high inflation and high FX depreciation. Mongolia’s thin currency liquidity makes this migration plausible if the conflict is sustained. South Eastern Europe is another candidate: moderate depreciation combined with rising CPI could worsen quickly if European gas prices spike further. These cross-scenario dynamics reinforce the importance of monitoring both FX and inflation indicators simultaneously rather than treating the two scenarios as independent.
Additional stress dimensions: maturity paywall and refinancing risk
Beyond FX and inflation vulnerability, two further stress channels merit close attention. First, the maturity paywall: as existing loan facilities approach their repayment dates, borrowers in stressed markets may face a wall of maturities that they cannot roll over. In a rising-rate environment, the refinancing terms available to these borrowers may be materially worse than the original facility, if refinancing is available at all. A partner lender that could comfortably service debt at 8–10% local rates may struggle at 14–18%, precisely the range that several of our higher-risk markets are approaching.
Second, capital-raising risk: some of our partner lenders are themselves intermediaries that depend on continuous capital inflows to sustain their lending operations. If these intermediaries cannot raise fresh capital, whether because local investor appetite has dried up, foreign DFIs have pulled back, or the cost of new issuance has become prohibitive, their ability to originate, and therefore their revenue base, contracts sharply. This creates a feedback loop: reduced origination leads to narrower margins, which, in turn, makes the next capital raise harder.
These risks are particularly acute in Mongolia (MNT policy rate already at 10%, limited domestic capital market depth), India (RBI rate corridor tightening) and South Eastern Europe (ECB policy divergence from local central banks). We are setting monitoring triggers for maturity concentrations and borrower fundraising timelines as a priority in the coming weeks.
Selected Source Notes
[1] Reuters. “Trump, Iran threaten power, energy targets as war escalates.” 23 March 2026.
[2] Reuters. “Iran says Hormuz open to all but ‘enemy-linked’ ships amid U.S. threat.” 24 March 2026.
[3] U.S. Energy Information Administration. “Amid regional conflict, the Strait of Hormuz remains a critical oil chokepoint.” 16 June 2025.
[4] U.S. Energy Information Administration. “About one-fifth of global LNG trade flows through the Strait of Hormuz.” 24 June 2025.
[5] Reuters shipping and insurance coverage on Hormuz disruption, 2 March 2026, and related updates.
[6] Reuters market coverage on the conflict’s opening oil shock. 28 February 2026.
[7] Reuters. “Goldman Sachs flags upside risks to oil prices in the near term and into 2027.” 19 March 2026.
[8] Reuters. “IMF says prolonged increase in energy prices could boost inflation, lower growth.” 19 March 2026.
[9] IMF. Gita Gopinath. “Steering through the Fog: The Art and Science of Monetary Policy in Emerging Markets.” 7 May 2025.
[10] Bank for International Settlements. “Commodity prices and monetary policy” (BIS Bulletin No. 96). 8 January 2025.
[11] BIS. Annual Report 2024 and related research on supply shocks, exchange rates and inflation regimes.
[12] Reuters India macro coverage on oil sensitivity, current-account risk and growth. 3 March 2026.
[13] Reuters FX and cross-asset market coverage on import-sensitive EM currencies. 18–20 March 2026.
[14] Reuters coverage on EBRD contingency planning for Eastern Europe and Central Asia. 16 March 2026.
[15] Reuters coverage on the longer-term Middle East risk premium in Gulf energy markets. 19 March 2026.
[16] BIS and ECB remarks on non-banks, private markets, unhedged foreign funding and external-shock absorption. Feb–Mar 2026.
[17] Kilde portfolio allocation data, internal.[18] Reuters cross-asset market coverage on oil, rates and equities after the conflict escalation. 20 March 2026.
[19] Kilde investment dashboard: tranche analysis, outstanding amounts by country/region. Accessed 24 March 2026.
Note: This article uses public-market and policy reporting available as of 24 March 2026, together with the portfolio mix provided by Kilde. It is intended as an analytical briefing, not investment advice.
Disclaimer Notice
This page is provided for general informational purposes only and does not constitute legal, financial, or investment advice. Please refer to our Full Disclaimer for important details regarding eligibility, risks, and the limited scope of our services.


![Non-Bank Financial Institutions and Private Credit Investment in Uzbekistan [2026 Update]](https://cdn.prod.website-files.com/625628af6992eb6ba8dd5c41/67bee8416ef9820506b5e8c8_nbfi-and-private-credit-investment-in-uzbekistan-thumbnail.avif)