

Returns of four assets in the turbulent last 12 months
I have written an article in January 2022, about an investment strategy I have made a year ago in January 2021. I have equally split my portfolio into four asset classes – stocks, high-yield bonds, US treasuries, gold, and an up and coming asset class private debt.
In 2021, we all have been for a wild ride but overall returns were positive across the asset classes with my favourite metal, gold, being an exception. I have concluded that in gross returns, the stock market has outperformed every other asset class by a wide margin. Precisely, the stock market investors took home a staggering 17.1% annual return. At the same time, the volatility of the stock market in 2021 was a frightening 11.4%. Hence, in perhaps too simple terms, the net “volatility free” return on the bullish stock market in 2021 was a mere 5.7%. I guess this makes sense to all of us as high returns also mean high risks.
If I take look at my portfolio a year back from today, a mid-May, the picture is quite different though. As a reminder, I have invested in Dow Jones Industrial Index (equity), PIMCO High-Yield Debt ETF (bonds), Gold (commodity), and a typical private debt bond sold at Kilde’s investment platform. I have picked a remarkable date of Friday the 13th of May to evaluate the investment for a year from 13 May 2021. How much money did I make or lose looking back from today, the spooky Friday?
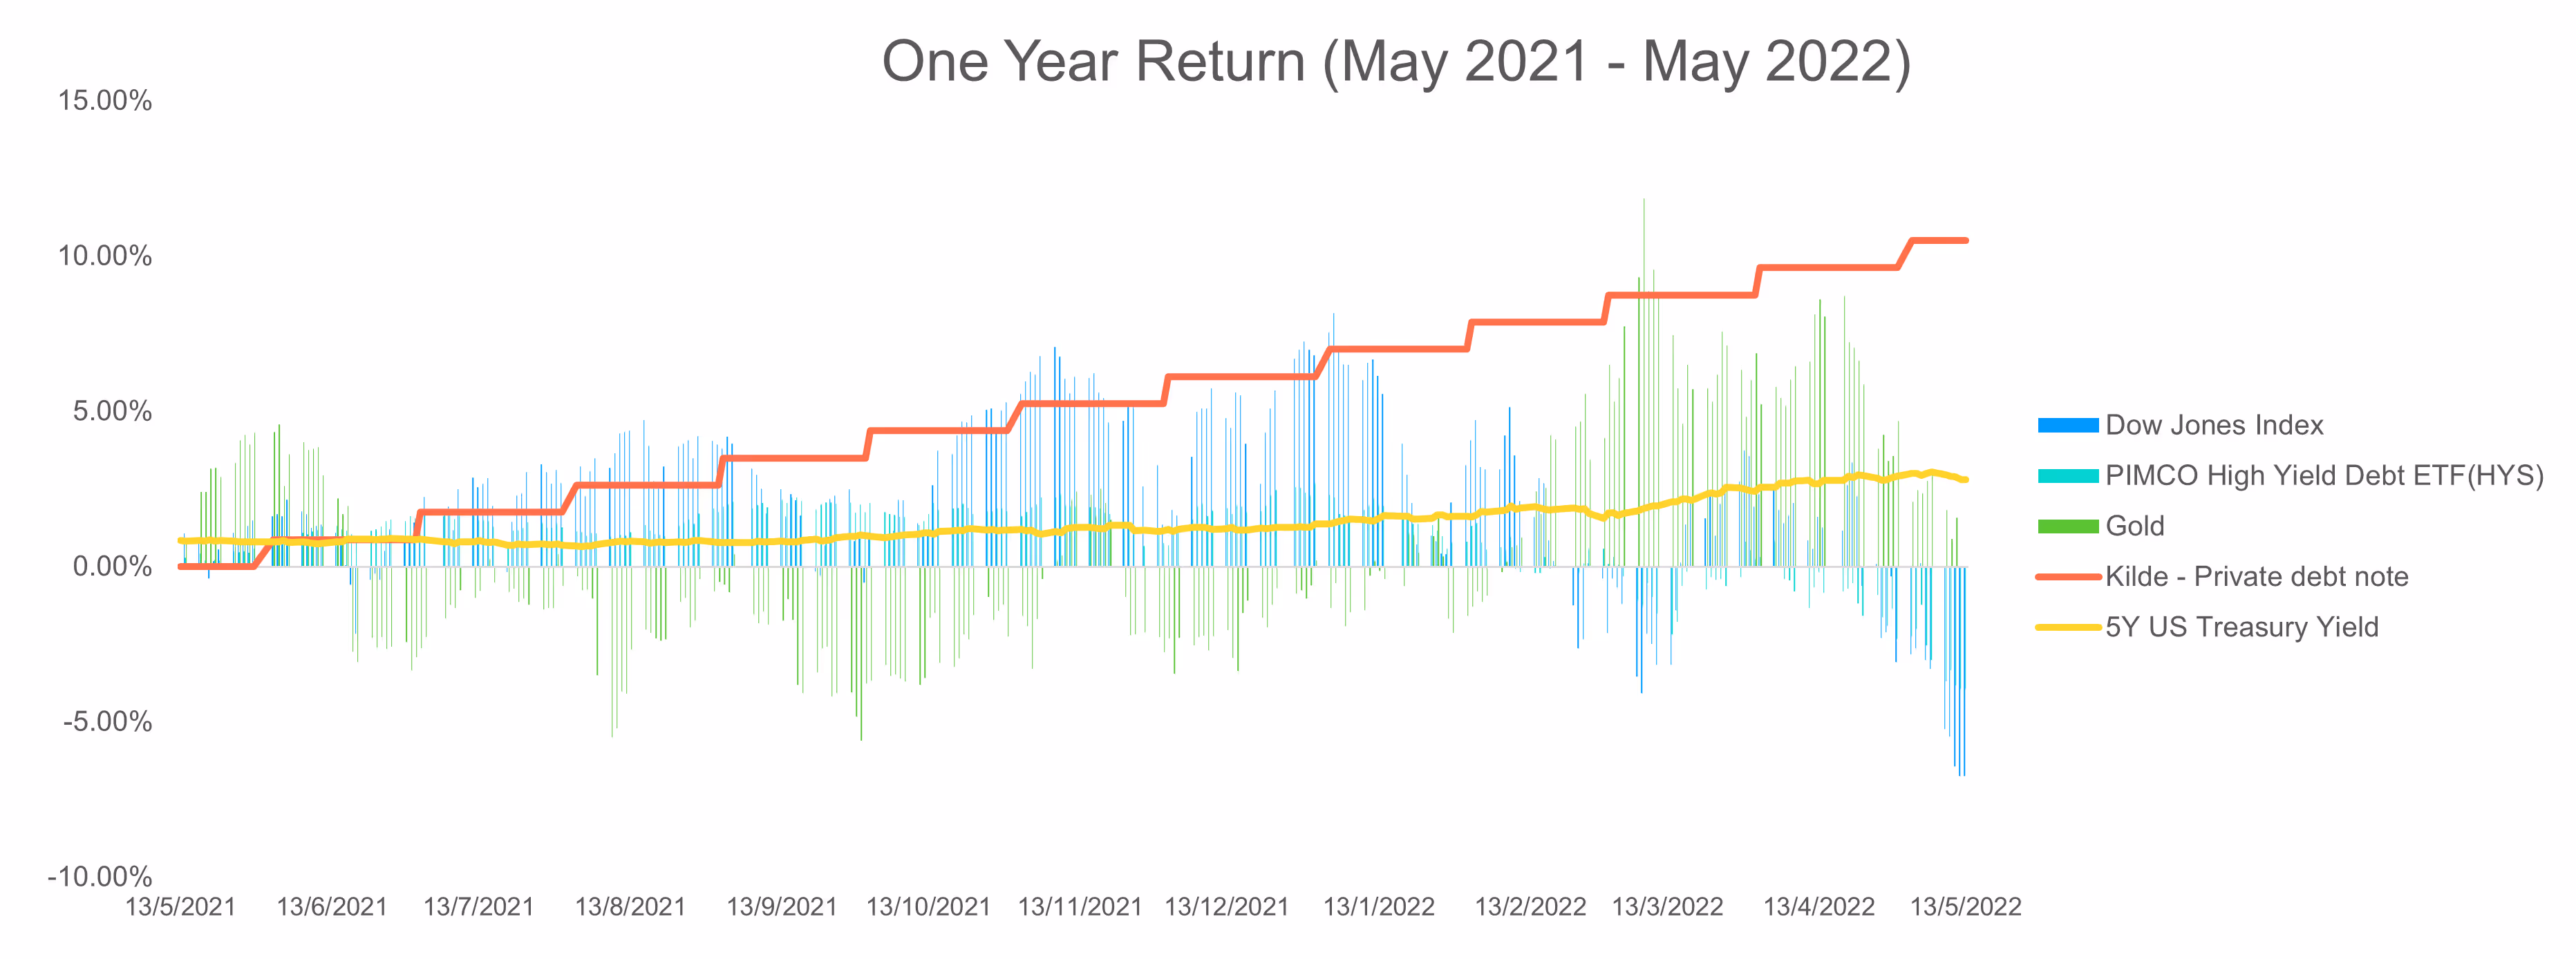
The chart above provides an answer. Today, I have -6.7% (loss) on Dow Jones Index investment, -3.9% (loss) on PIMCO’s ETF, I am at zero on Gold, and still +10.5% on the Private Debt Note.
How to measure the volatility of an investment?
Nevertheless, this is not the whole story. If I did not have the patience to hold the investment until today, I may have made less or more thanks to market volatility.
A good measure of volatility is the standard deviation. I have calculated it considering daily price movements and then annualizing the resulting figure using a number of trading days.
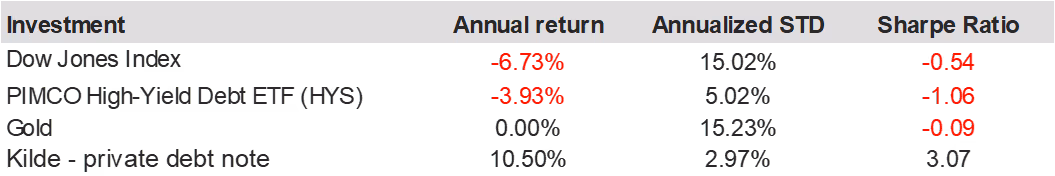
In the previous review, Dow Jones Index provided the highest return but while doing so exposed investors to high volatility of 11.4%. Well, today Dow Jones is the worst performer with even higher volatility of more than 15%. In January the worst performer was Gold on which investors lost more than 5% during 2021. Gold has remained volatile but at least this time it held value. Publicly traded high-yield bonds lost almost 4% but with ups and downs of 5% on average.
Sharpe ratio - bringing returns and volatility together
Why not combine return and volatility into a single number? This is exactly what the Sharpe ratio does for us. It is defined as “Return less risk-free rate divided by volatility”. Generally, the Sharpe ratio above 1 is considered good, and more than 2 is very good. Results below 1 indicate that the investment involves risk (measured by volatility) which is not sufficiently compensated by high enough returns.

Unfortunately, all publicly traded assets have produced not only a Sharpe ratio below 1 (bad risk-return investment) but also a negative one (I have actually lost money).
Why do private investments have a high Sharpe ratio?
Why did private debt notes beat all exchange-traded investments? Private investments are not exposed to volatility caused by fluctuating supply and demand at exchanges. Therefore, returns of private debt investments (also referred to as yield) remain constant during the holding period. But wait, why does a private debt instrument still have implied volatility in the table above? It is because private debt is not risk-free either. There is a risk that the borrower does not return the capital. This risk is quantified by a probability of default which in our case is less than 3% per year. At the same time, this is a risk that I have chosen to carry forward but which does not materialise every day by up and down swings of the bond price. With this, I have partially sacrificed the possibility to cash out of the private debt note on any given day.
In conclusion, there is still no free lunch out there but I have helped the performance of my portfolio by including the private market instruments. When chosen correctly, they offer a much-needed shelter in the market storm. As their returns are typically north of 8%, they also keep up with the expected returns of a growth investment portfolio. I will keep you updated on how is my portfolio doing.
Kilde is a regulated investment platform for alternatives. We operate as a two-sided platform connecting institutions / HNWI with securitised private investments. Our main alternative asset classes are private debt, venture debt, and recurring revenue financing. Kilde has partnered with leading non-banking consumer & SME lending firms to give investors safe and controlled access to consumer lending assets. Our unfair advantage is vast accumulated data on consumer & SME assets performance as well as scalable investment and securitisation tech platform. Thanks to Kilde’s license for dealing in securities, we securitize alternative investments into digital securities.
Disclaimer Notice
This page is provided for general informational purposes only and does not constitute legal, financial, or investment advice. Please refer to our Full Disclaimer for important details regarding eligibility, risks, and the limited scope of our services.


![Non-Bank Financial Institutions and Private Credit Investment in Uzbekistan [2026 Update]](https://cdn.prod.website-files.com/625628af6992eb6ba8dd5c41/67bee8416ef9820506b5e8c8_nbfi-and-private-credit-investment-in-uzbekistan-thumbnail.avif)


